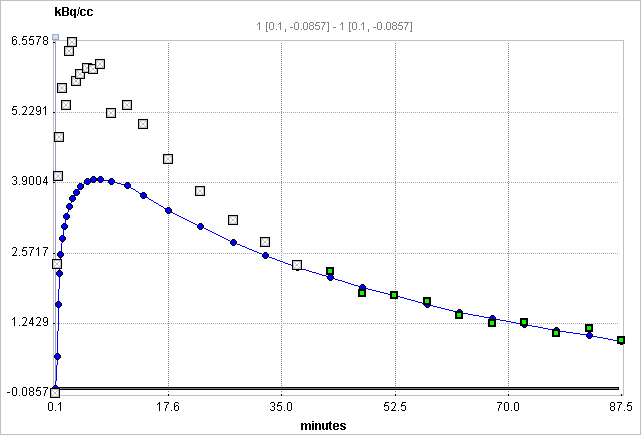
Ichise's MA1 analysis method [1] is a technique for calculating the total distribution volume for receptor tracers with reversible binding. It is a further development of the Logan Plot aimed at minimizing the bias induced by noise in the measurements.
Operational Model Curve
The following bilinear relationship was derived

where CT(t) represents the tissue time-activity curve, CP(t) the plasma activity, VT the total distribution volume, and b the intercept of the Logan plot which becomes constant after an equilibration time t*.

Note that an explicit blood volume correction is available via the vB input parameter. In the case of vB=0 (default setting), no correction is performed. For vB>0, the tissue TAC is corrected by the scaled whole blood activity before the actual analysis as follows.

Based on simulation and experimental data the authors show that MA1 demonstrates the largest bias reduction among several methods. Therefore they conclude, that MA1 is the method of choice for calculating the total distribution volume, if t* can accurately be defined.
Parameter Fitting
The bilinear regression is performed using singular value decomposition. The result are the two coefficients VT/b and b, from which Vt can easily be derived.
The MA1 method requires specification of the equilibration time as the t* parameter. As it equals the equilibration time of the Logan plot, it is possible to perform a Logan plot first and use the resulting Logan t*.
t* can also be estimated using an error criterion Max Err. For instance, if Max Err. is set to 10% and the fit box of t* is checked, the model searches the earliest sample so that the deviation between the regression and all measurements is less than 10%. Samples earlier than the t* time are disregarded for regression and thus painted in gray. In order to apply the analysis to the same data segment in all regions, please switch off the fit box of t*, propagate the model with the Copy to all Regions button, and then activate Fit all regions.
Reference
1.Ichise M, Toyama H, Innis RB, Carson RE: Strategies to improve neuroreceptor parameter estimation by linear regression analysis. J Cereb Blood Flow Metab 2002, 22(10):1271-1281. DOI