Ichise's MA2 analysis method [1] is another alternative technique developed to calculate the total distribution volume of reversible receptor systems with minimal bias. It is particularly suitable for tracers with slow kinetics and low to moderate noise.
The MA2 method has two advantages:
1.It is independent of an equilibration time, so that the data from the first acquisition can be included into the regression.
2.An estimate of the specific distribution volume is also obtained. The authors state, that although the method has been derived with the 2-tissue model, it still shows a good performance with the data representing only 1-tissue characteristics.
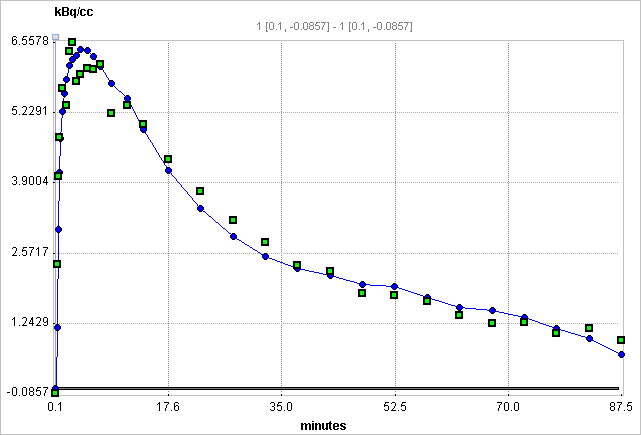
Operational Model Curve
Based on the 2-tissue compartment model equations the following multi-linear relationship was derived [34]:

where CT(t) represents the tissue time-activity curve, and Cp(t) the plasma activity.

A multi-linear regression can be performed to calculate the four regression coefficients from the transformed data. The total distribution volume VT is then calculated as the ratio of the first two regression coefficients, and the distribution volume of specific binding VS by the expressions

Note that an explicit blood volume correction is available via the vB input parameter. In the case of vB=0 (default setting), no correction is performed. For vB>0, the tissue TAC is corrected by the scaled whole blood activity before the actual analysis as follows.

Parameter Fitting
The multi-linear regression is performed using a singular value decomposition, resulting in the 4 regression parameters p1, p2, p3, p4, and the derived distribution volumes Vt and Vs. Although no equilibration time is required for MA2, there is a t* parameter to disregard early samples from the regression as for the Logan plot and MA1.
Reference
1.Ichise M, Toyama H, Innis RB, Carson RE: Strategies to improve neuroreceptor parameter estimation by linear regression analysis. J Cereb Blood Flow Metab 2002, 22(10):1271-1281. DOI